Introduction to SDAT Dataset Page
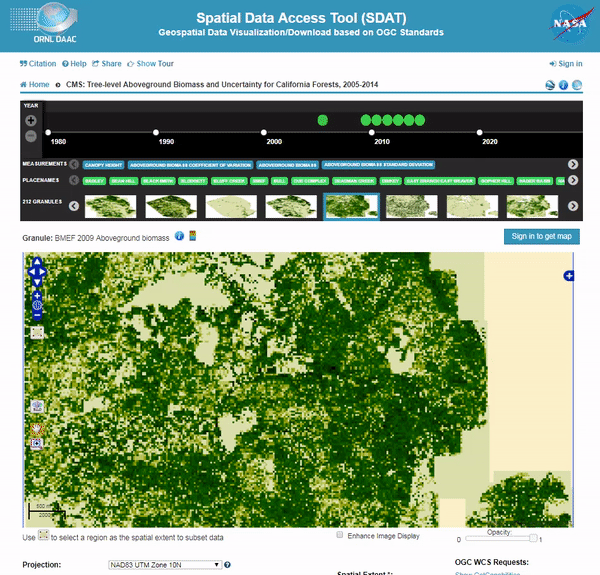
The SDAT main page provides rich file-level metadata information on the top, OpenLayers-based interactive map widget in the middle, and WCS-based options for on-demand data access on the bottom. See the screenshot below for detailed information.
Watch the animation to see how to narrow down to the data file of your interest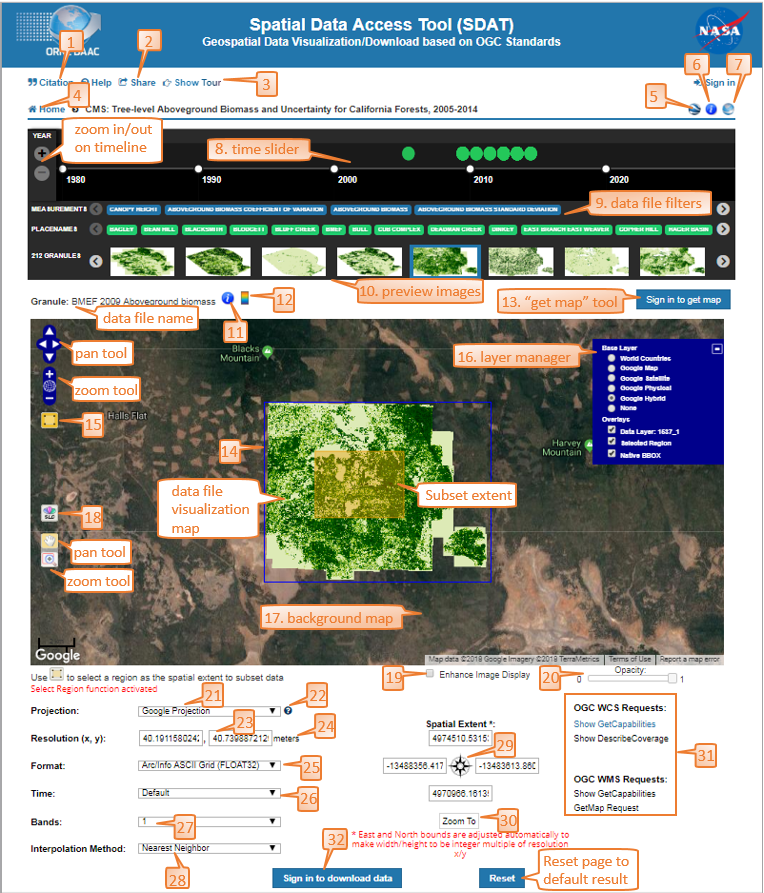


Notes:
- Click this button to view Tool citation and Dataset Citation
- Link to current data file
- Click this button to display tour guide
- Link to SDAT main page
- Link to KMZ file of dataset
- Link to dataset documentation page
- Link to ORNL DAAC dataset page
- Time slider allows user to filter data files by its time range. Drag across the top part of the timeline to make single temporal selection. Click top part of the timeline outside current temporal selection to clear selection. Drag the middle part of the timeline to go through different time.
- Click single or multiple filters to find data files. Click filter again to remove it
- Click preview image to visualize in the interactive map widget below
- Click this button to show detailed metadata of current data file
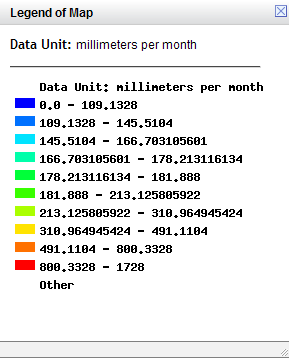
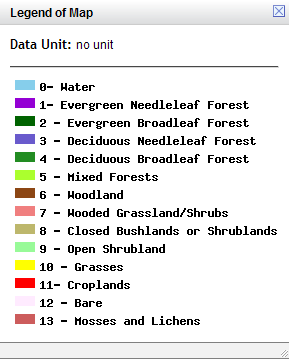
- Click this button to open the legend (or color table) used for the data file's visualization map. Below are two legend examples:
- Click this button to open the "Get Map" window. The "Get Map" tool allows users to create maps for the current data file and download maps in different format, size, and projection.
- This blue box marks the the full extent of the currect data file in the current selected projection. Use "Layer Manager" to turn it on/off by checking/unchecking "Native BBOX" layer.
- "Select Subset Spatial Extent Tool": Use this tool to draw a rectangle area on the map widget as the subset spatial extent. This tool is a mutex to the "Zoom Tool" and "Pan Tool" below it. Click it to toggle this tool on/off.
- "Layer Manager": Click on the "+"/"-" button to open/close the layer manager window. The layer manager allows users to switch base layer and turn on/off overlay layers.
- "Background Map": The background map on which users can overlay geospatial data visualization map. Different background maps are available in different projections. For example, in WGS84 projection, Bing Virtual Earth and Open Street Map layers are available from 3rd party WMS services; in Google Projection, Google Map/Satellite/Physical layers are available. Users can switch to a different background map by switching "Base Layer" in the layer manager.
- Change data file visualization map style through SLD
- Check this box to visualize the current data file using a color table created based on the min/max/stddev values of this particular data file. If it is unchecked, the color table was created based on the min/max/stddev values of the whole data set. Usually "Enhance Image Display" option will produce a visualization map with higher contrast ratio.
- Use the slider to change the opacity of the data file's visualization map displayed on the map widget. 0 means the map is totally transparent and 1 means the map is totally opaque.
- Select a projection from the list to visualize and download the data file.
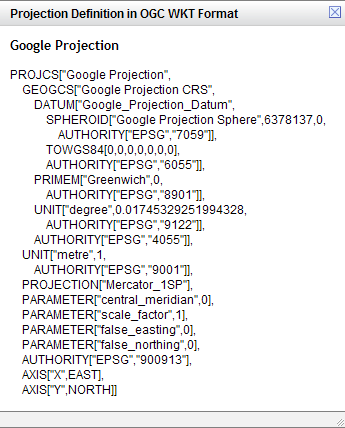
- Click on this "[?]" link to popup a window containing the OGC Well Known Text (WKT) definition of the current selected projection. Below is the WKT definition for Google Projection:
- Spatial resolution (in X and Y directions) for geospatial data download.
- Units of the spatial resolution.
- The data format in which the downloaded geospatial data will be.
- If a data file contains multiple time steps, they will be listed here. Users can select any time step from the list to subset the data file and download only selected time step. Users can also select "All" to download all time steps (note: Arc/Info ASCII Grid and NITF formats don't support multiple time steps).
- If a data file contains multiple bands, they will be listed here. Users can select any band from the list to subset the data file and download only selected band. Users can also select "All" to download all bands (note: Arc/Info ASCII Grid and NITF formats don't support multiple bands).
- Interpolation method used by the backend WCS service if resampling process is required.
- The current selected/specified subset spatial extent. Users can use the "Select Subset Spatial Extent Tool" to enter an extent automatically or enter an extent manually.
- Click the button to zoom to map widget to the area that fit the currect selected/specified subset spatial extent most.
- OGC Requests Section: It contains URL links to each WCS,WMS request: GetMap,GetCapabilities, DescribeCoverage, and the most recent GetCoverage request. The GetCapabilities request will get the whole Capabilities XML document. The DescribeCoverage request will get the coverage description XML document for the current data file.
- Click the "Download" button to download the data file with current selected/specified projection, format, spatial resolution, time steps, bands, and interpolation method.
